


The Cost of Transporting Coal to the Electric Power Sector Increased in 2022
The Cost of Transporting Coal to the Electric Power Sector Increased in 2022
The average transportation cost for coal in the United States rose from $17.02 per ton in 2021 to $18.69 per ton in 2022 (in 2022 dollars).

The Energy Information Agency released new data on the electric power sector’s coal transportation costs. The release incorporates final data for 2022 from Form EIA-923, which they collect from electric power plant owners and operators.
The data release based on the EIA Form EIA-923 includes tables with costs, in nominal and real (2022) dollars, across regions, states, and modes of transportation.
Data highlights
The average transportation cost for coal in the United States rose from $17.02 per ton in 2021 to $18.69 per ton in 2022 (in 2022 dollars).
Transportation costs increased across all three modes (railroad, waterway, and truck) and across almost all regional and state routes. Costs decreased in two cases, one involving railroad transport from the Illinois Basin to West Virginia, the other involving waterway transport within the state of Pennsylvania.
From the EIA:
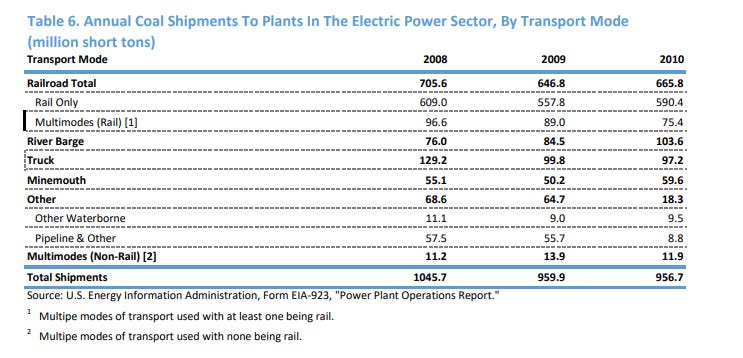
This recent update of the Coal Transportation Rates to the Electric Power Sector web page incorporates final Form EIA-923 data for 2021 and updates the tables with data in nominal and real 2022 dollars. The data tables are based on primary data that we collect from plant owners and operators on Form EIA-923, Power Plant Operations Report, and on supplement data and analysis of coal transportation costs that we released in June 2011 and November 2012.
The initial report on coal transportation rates covered 2001 through 2008, applied only to railroad shipments, and was based exclusively on waybill sample data obtained from the U.S. Surface Transportation Board (STB). The supplemental report provided an additional year of waybill sample data and incorporated data that we collected on Form EIA-923 for shipments by railroad, waterway, and truck for 2008 through 2010. The third set of tables on coal transportation rates were based on Form EIA-923 data for 2008 through 2012. The rates for 2008 and 2010 were slightly different from the rates we previously published due to minor changes in methodology. Transportation rates for 2011 and 2012 had not been previously published. The current release provides final rates for the years 2008 through 2020. We can no longer update waybill data due to STB's modified interpretation of its data confidentiality obligation.
As in previous iterations of Form EIA-923 data, the rates are based on primary mode of transportation. Because some shipments include a primary and secondary mode of transportation, these rates do not necessarily reflect the rates associated with only one transportation mode. In addition, the rates do not reflect shipments made to cogenerators and other end users of electricity, and they are based only on shipments made to plants in the electric power sector. We define the electric power sector as consisting of electric utilities and regulated and unregulated independent power producers.
We calculate nominal rates by subtracting the commodity cost of the delivered coal from the total delivered cost, as reported by owners and operators of power plants with a combined nameplate capacity of 50 megawatts or greater. Because the commodity cost and delivered cost data are reported in terms of energy content (that is, million British thermal units), the costs are converted to dollars per ton using the average energy content of each shipment reported on the form. The representative transportation cost for each coal mine state, destination state, and transportation mode is a weighted average. Lastly, we convert the values to constant 2022 dollars by using the Implicit Price Deflators for Gross Domestic Product, as published by the U.S. Bureau of Economic Analysis in Table 1.1.9 of the National Income and Products Accounts tables.
We make several assumptions when calculating the transportation costs. Most notably, we apply an internal methodology to identify and exclude costs that we believe to be outliers. In addition, we use only records that have reported values for commodity cost and delivered cost (in other words, we do not use imputed values).
We assign coal shipments to basins based on counties as set out below.
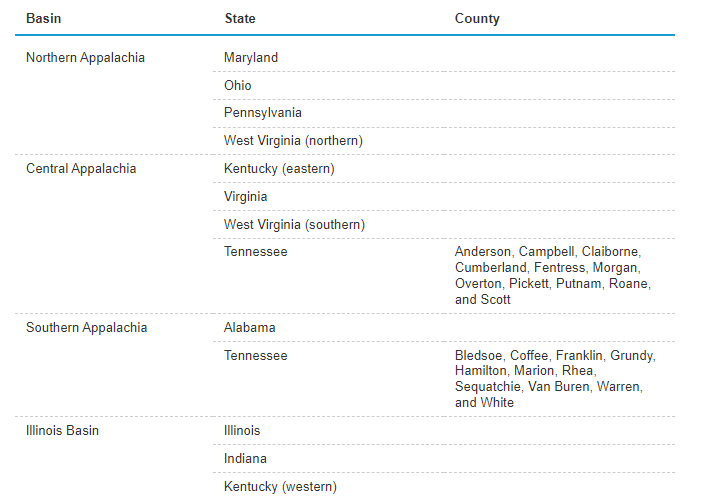
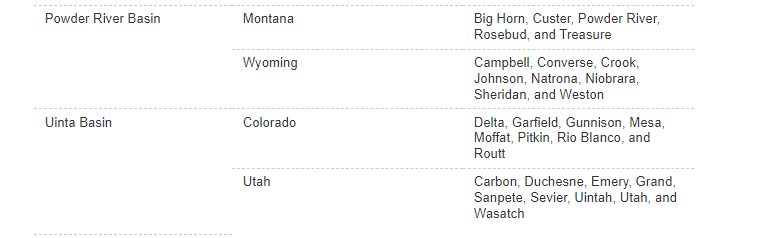
Our data include shipments to blank counties that originated in 13 states (generally because the plant purchases coal from a blender that uses coal purchased from multiple mines). In such cases, we assign the shipments to a coal basin based on the origin state and, when appropriate, other factors. We assign shipments originating in Alabama to southern Appalachia because it is the only coal basin in the state. Similarly, we assign shipments originating in Maryland, Ohio, and Pennsylvania to northern Appalachia, and we assign all shipments originating in Illinois and Indiana to the Illinois Basin. Although Tennessee overlaps both central Appalachia and southern Appalachia, coal has not been produced in southern Appalachia since 1990, so we assign all shipments to central Appalachia. In addition, we assign all shipments originating in Utah to the Uinta Basin even though, in theory, a small number of the shipments originated in coal mines that are not technically part of the basin.
For coal with a missing county that originated in Kentucky, we assign all shipments with an average sulfur content greater than 2.4% to the Illinois Basin and the others to central Appalachia. For coal with a missing county that originated in West Virginia, we assign all shipments with an average sulfur content greater than 1.6% to northern Appalachia and the others to central Appalachia. For coal with a missing county that originated in Wyoming, we only assigned shipments with an average energy content less than or equal greater 17.9 million British thermal units per ton to the Powder River Basin.
Because cost data collected on Form EIA-923 are confidential, we had to ensure that we suitably aggregated rates to prevent any individual rates from being observed or inferred. To meet this requirement, we withheld rates where the number of plants within a particular aggregation of rates was less than three.
MORE FROM THE CRUDE LIFE
Please click that ♡ button, share, and subscribe.
Please share the links on social media.
Thank you thank you thank you for your engagement and support.
If you have a news tip, press release, guest suggestion or other content concepts, please email thecontentcreationstudios(AT)gmail(DOT)com
This post was brought to you in part by one of The Crude Life’s fantastic sponsors, please consider supporting their services or learning more about their organization by clicking on the banner below.

Witting Partners helps energy industry leaders achieve and sustain peak performance by combining an unmatched blend of oil & gas experience, insight, and results with the power of leadership coaching, workshops, and keynotes so that you and your stakeholders don't un-wittingly damage your odds of achieving long-term success.
If you want to produce 𝑺𝑼𝑺𝑻𝑨𝑰𝑵𝑨𝑩𝑳𝑬 results, then turn to a resource with 15+ years of proven success stretching from the Gulf of Mexico to Appalachia, from service company to operator, and from drilling rig to downtown boardroom.
To learn more, visit Witting Partners’ website or follow on LinkedIn.
This has to do with the rise in the price of diesel. Fuel cost in a direct input for rail companies so much so that many have now implement surcharges for fuel. So in a weird way since rail companies run on diesel engine, one can argue that without oil the ability to use coal would be diminished. A lower oil price means lower coal prices!